Using SESSION STATISTICS functionality
Installation requirement
To enable the Session Statistics module in dbWatch, the job “Session statistics” must be installed on the SQL Server instance.
The module will not appear in the Management tree, and no statistics will be collected, until this job is added.
Once the job is installed and scheduled, dbWatch begins collecting session activity, SQL text, and historical metrics required for the module.
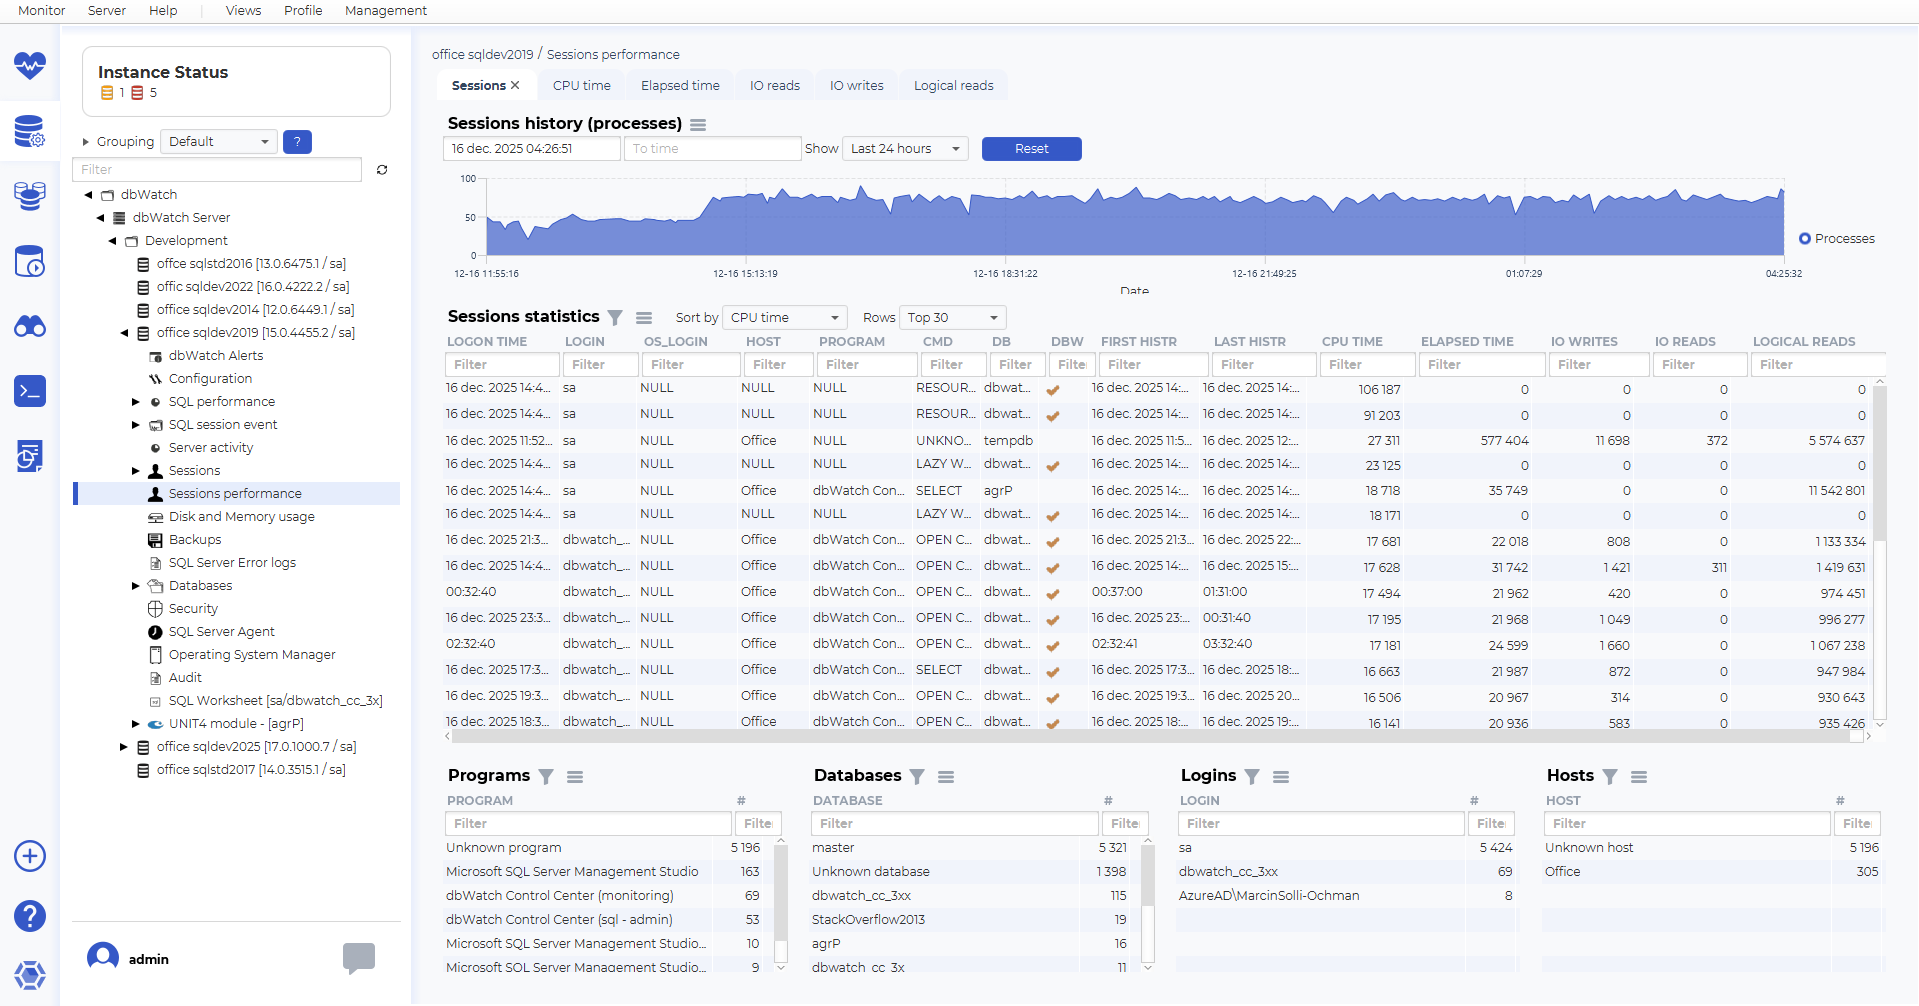
The Session Statistics module in dbWatch provides both real-time and historical insight into SQL Server session activity.
It shows who is connected, what they are running, how many resources they consume, and how activity changes over time.
The module helps DBAs identify heavy sessions, diagnose performance issues, and understand workload patterns across users, applications, databases, and hosts.
What data is collected?
The Session Statistics module collects and stores:
Session identity
Login and OS login
Host/workstation
Program/application name
Executed command type (SELECT, INSERT, BACKUP, OPEN CURSOR, etc.)
Session lifecycle
Login time
Last batch execution time
First seen and last seen timestamps
Whether the session is new, active, or only connected
Resource usage
CPU time (total and delta)
Elapsed time
Physical I/O
Reads, writes, logical reads
Memory usage
SQL statement boundaries (stmt_start / stmt_end)
SQL text history
SQL handle
Full SQL text
Database ID
Last seen timestamp
Internal dbWatch statistics
Total number of sessions collected
Total historical sessions
Active vs. inactive sessions
Unique logical sessions
SQL text records
Repository size (MB)
Execution time of the statistics job
This information allows dbWatch to present a detailed timeline of workload and resource consumption.
Sessions history (processes)
The top section displays a time-series graph showing the number of active processes over time.
This graph helps identify:
Workload peaks
Times of low activity
Patterns throughout the day or week
Downtime periods
You can choose predefined intervals such as Last 24 hours or set custom time ranges.
Selecting a custom time interval
You can click and drag on the graph to highlight a specific time interval.
The selected range automatically populates the From time and To time fields.
This allows DBAs to:
Zoom in on spikes or anomalies
Investigate periods of high load
Focus on workload activity around incidents
Filter the session table to the same time window
Use the Reset button to return to the full view.
Session statistics (table)
Below the graph is a detailed table that lists all collected sessions for the selected time range.
Columns typically include:
Login time
Login and OS login
Host
Program
Command
Database
First and last history timestamps
CPU time
Elapsed time
IO writes
IO reads
Logical reads
This table supports:
Sorting
Filtering
Selecting the Top N rows
It is extremely useful for identifying:
Long-running sessions
High CPU or IO consumers
Idle connections
Repeated patterns from applications
Programs overview
Shows which client programs generate session activity.
Examples:
Microsoft SQL Server Management Studio
dbWatch Control Center
Custom application clients
Background services
Helps DBAs understand which tools produce load and how they behave.
Databases overview
Displays how many sessions and statements interacted with each database.
Useful for identifying:
Hotspot databases
Reporting/ETL workloads
Low-usage databases
Logins overview
Summarizes activity by SQL login, such as:
sa
dbWatch service logins
AzureAD logins
Application accounts
Provides insight into which users generate the most load.
Hosts overview
Shows activity by originating host.
Examples:
Application servers
Developer machines
Script servers
Unknown or legacy hosts
Helps identify workload sources and highlight unusual client activity.
Context menu actions (Programs, Databases, Logins, Hosts)
Right-clicking items in the Programs, Databases, Logins or Hosts overview provides useful shortcuts:
Show CPU usage
Displays CPU usage history for sessions tied to the selected item.
Show sessions history
Filters the session history graph and session table to show only sessions related to the chosen program/database/login/host.
Used databases
Shows which databases were accessed by the selection.
Used hosts
Shows which hosts were involved for a selected program or login.
Used logins
Reveals which SQL logins are associated with the selected program or host.
Copy Row / Copy Row w/header / Copy Cell
Utility functions for exporting table data to spreadsheets, logs or documentation.
Metric subcharts (CPU time, Elapsed time, IO reads, IO writes, Logical reads)
Below the main Sessions history (processes) graph, the module provides additional metric charts:
CPU time
Elapsed time
IO reads
IO writes
Logical reads
These subcharts always display data for the same time interval that is selected in the main Sessions history (processes) graph.
When a user:
Selects a predefined period (e.g. Last 24 hours)
Chooses a custom range using From time / To time
Or marks a time window by clicking and dragging in the graph
—all metric charts automatically update to show values only for that matching period.
This ensures consistency and makes it easy to correlate session counts with resource consumption trends during the same timeframe.
Summary
The Session Statistics module provides:
A real-time and historical overview of SQL Server sessions
Insight into resource consumption and workload behaviour
Drill-down tools for programs, databases, hosts and logins
Visual timeline selection for focused analysis
Accurate representation of activity, including downtime indicators
Together with SQL Performance and SQL Session Event modules, it delivers a complete understanding of who is doing what, when, and at what cost on the SQL Server instance.
Example main view: